In a competitive environment, visual communication based on data found within a company, as well as data beyond the company, is crucial for making quality decisions.
Data improves business performance. However, its sheer volume and the speed at which it is created make it difficult to be turned into the useful information we want.
What is the purpose of data collection? What is our goal when using data? These are more important questions than that of speed or the amount of data, and they are a prerequisite for the development of a “data culture” within a company.
Experience and knowledge of business processes are invaluable to a company's business activities. When complemented with data-based decision making, new ideas are born and business is improved.


We get to know your business processes and data, as well as the way in which you do and run your business. In collaboration with you, we define the data needed to develop a report, as well as key performance indicators (KPIs) for various industries.
Using modern tools, we extract, transform, analyse and verify your data. If necessary, we connect existing data with data from external sources.
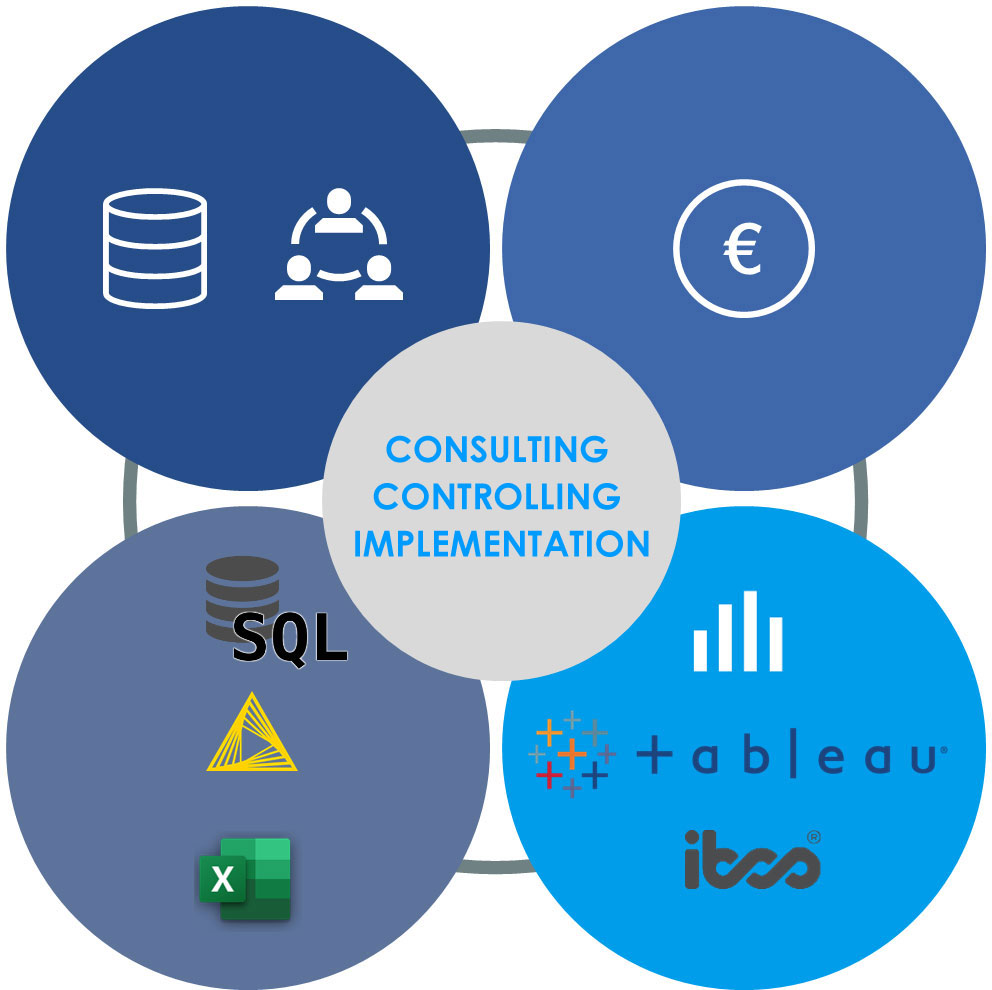
Data and reports are monetized through savings, an increase in revenue, market shares, new business opportunities and the improvement of existing business processes.
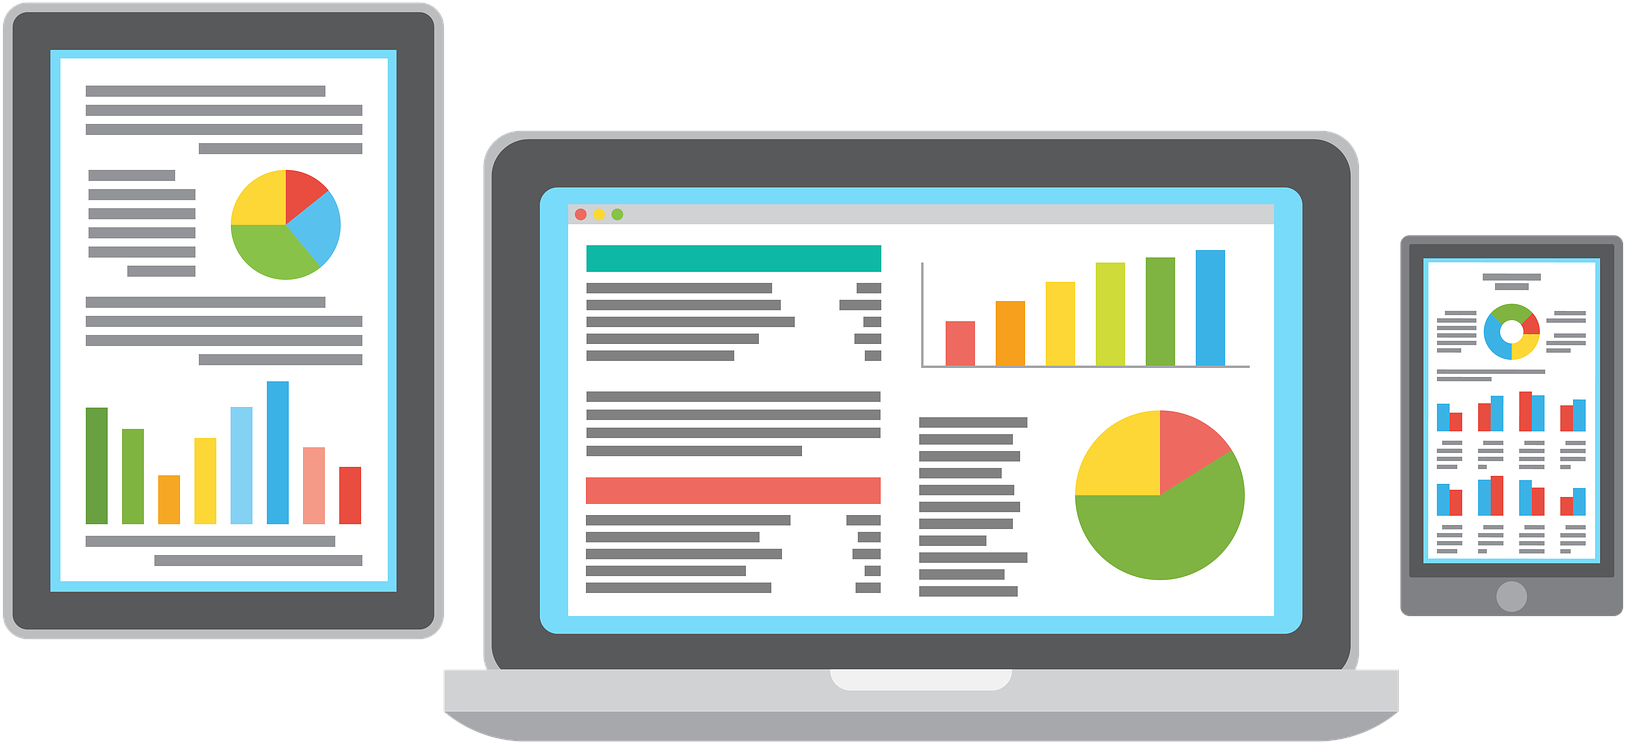
Advanced visual tools allow us to create interactive, fast, and intuitive reports that provide insight into your business in accordance with IBCS standards. Reports are automatically refreshed according to the desired schedule.
 Igor Milovčić
 Igor has over 15 years of experience in finance, accounting and controlling. Upon completing his graduate studies at the Faculty of Economics in Zagreb, he began a career in brokerage and has also met the challenge of health management. Since 2017, he has been involved in the development and creation of a data culture for healthcare management where he has applied IBCS skills. He develops data models, automates business processes, creates BI reports in Tableau, and provides training in data analysis using Tableau. He continuously develops new skills in data analysis using the latest BI solutions.
 Ivan Horvat
 Ivan has over 13 years of experience in financial analysis, sales, controlling and HR. After his graduate studies in project management, he completed his postgraduate studies in marketing, where he became interested in BI systems and data analytics. In 2016, he implemented the Table system in the largest hospital in the Republic of Croatia and participated in its development and use employing IBCS skills. He develops data models, automates business processes, creates BI reports in Tableau, and provides training in data analysis using Tableau. He continuously develops new skills in data analysis using the latest BI solutions.
Visibillions d.o.o.
Savska cesta 15, Zagreb
info@visibillions.com
Contact:
Igor Milovčić dipl. oec.
+385 91 151 6880
igor@visibillions.com
Ivan Horvat univ. spec. oec.
+385 99 191 9411
ivan@visibillions.com